 AR
AR
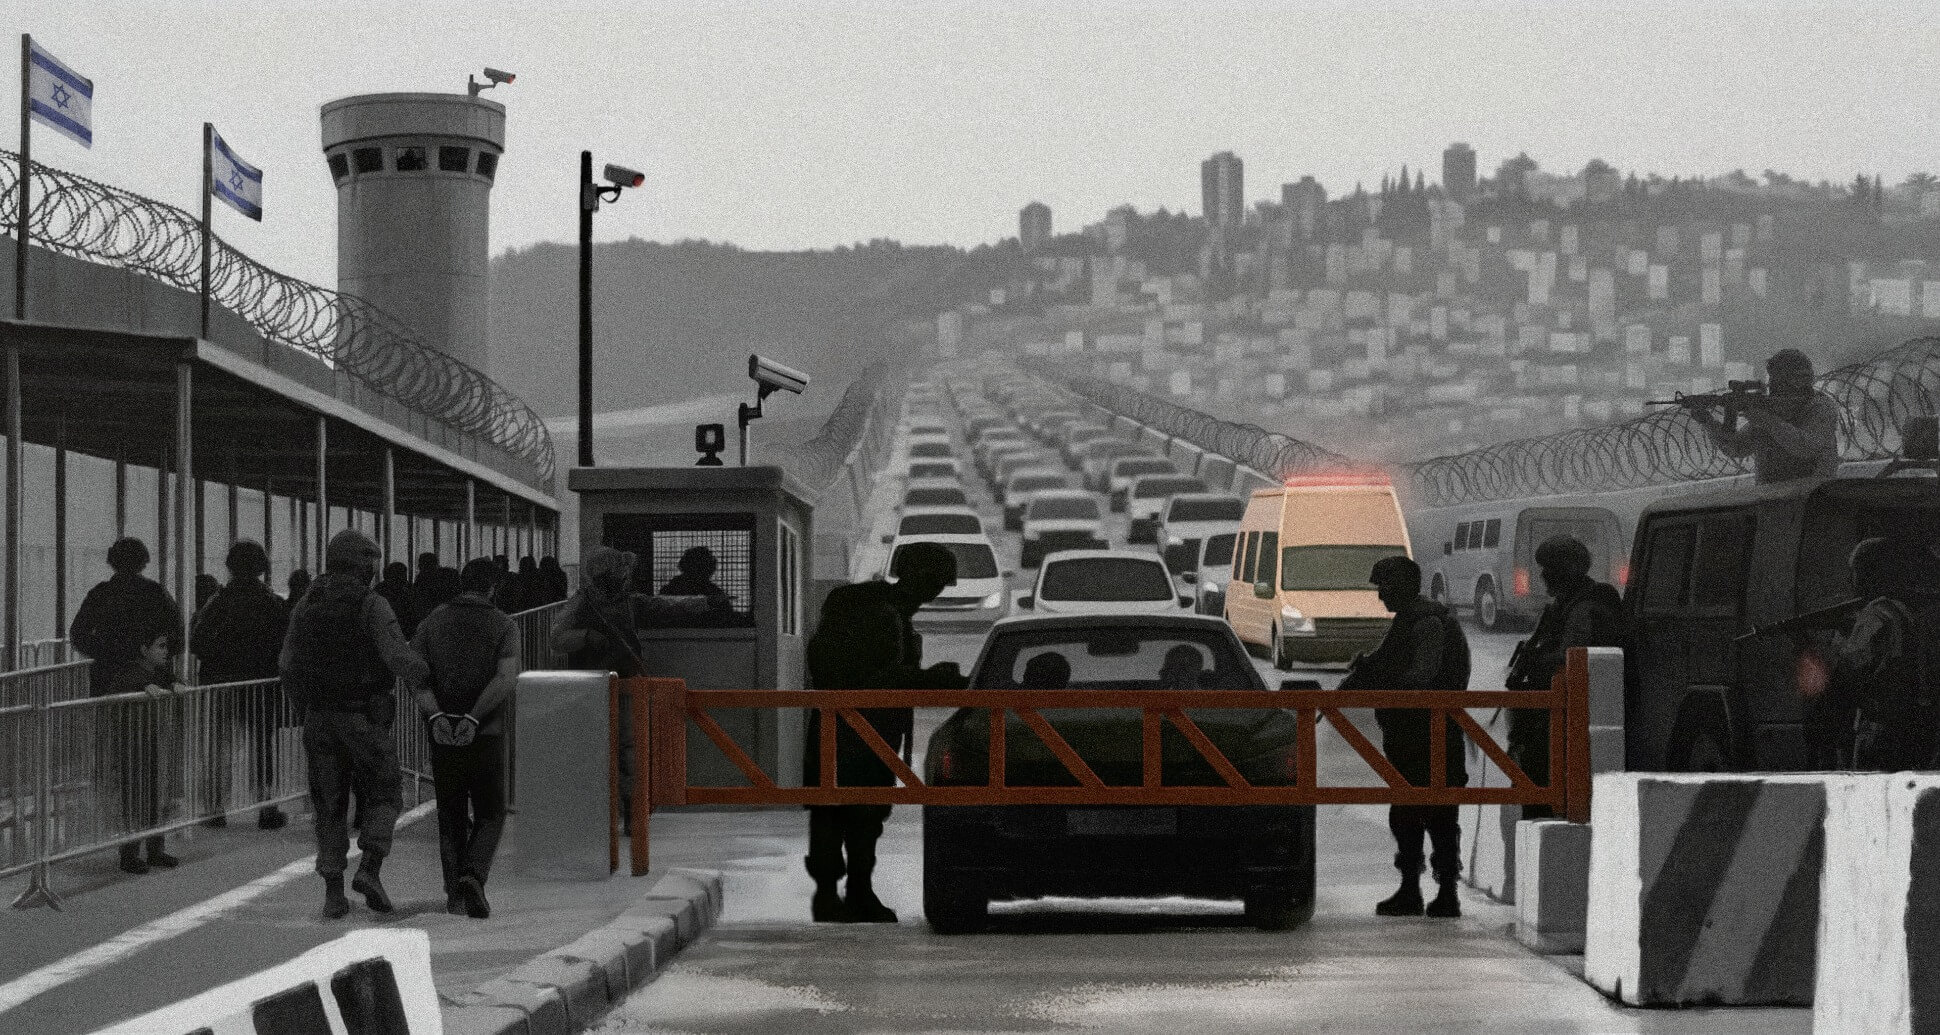
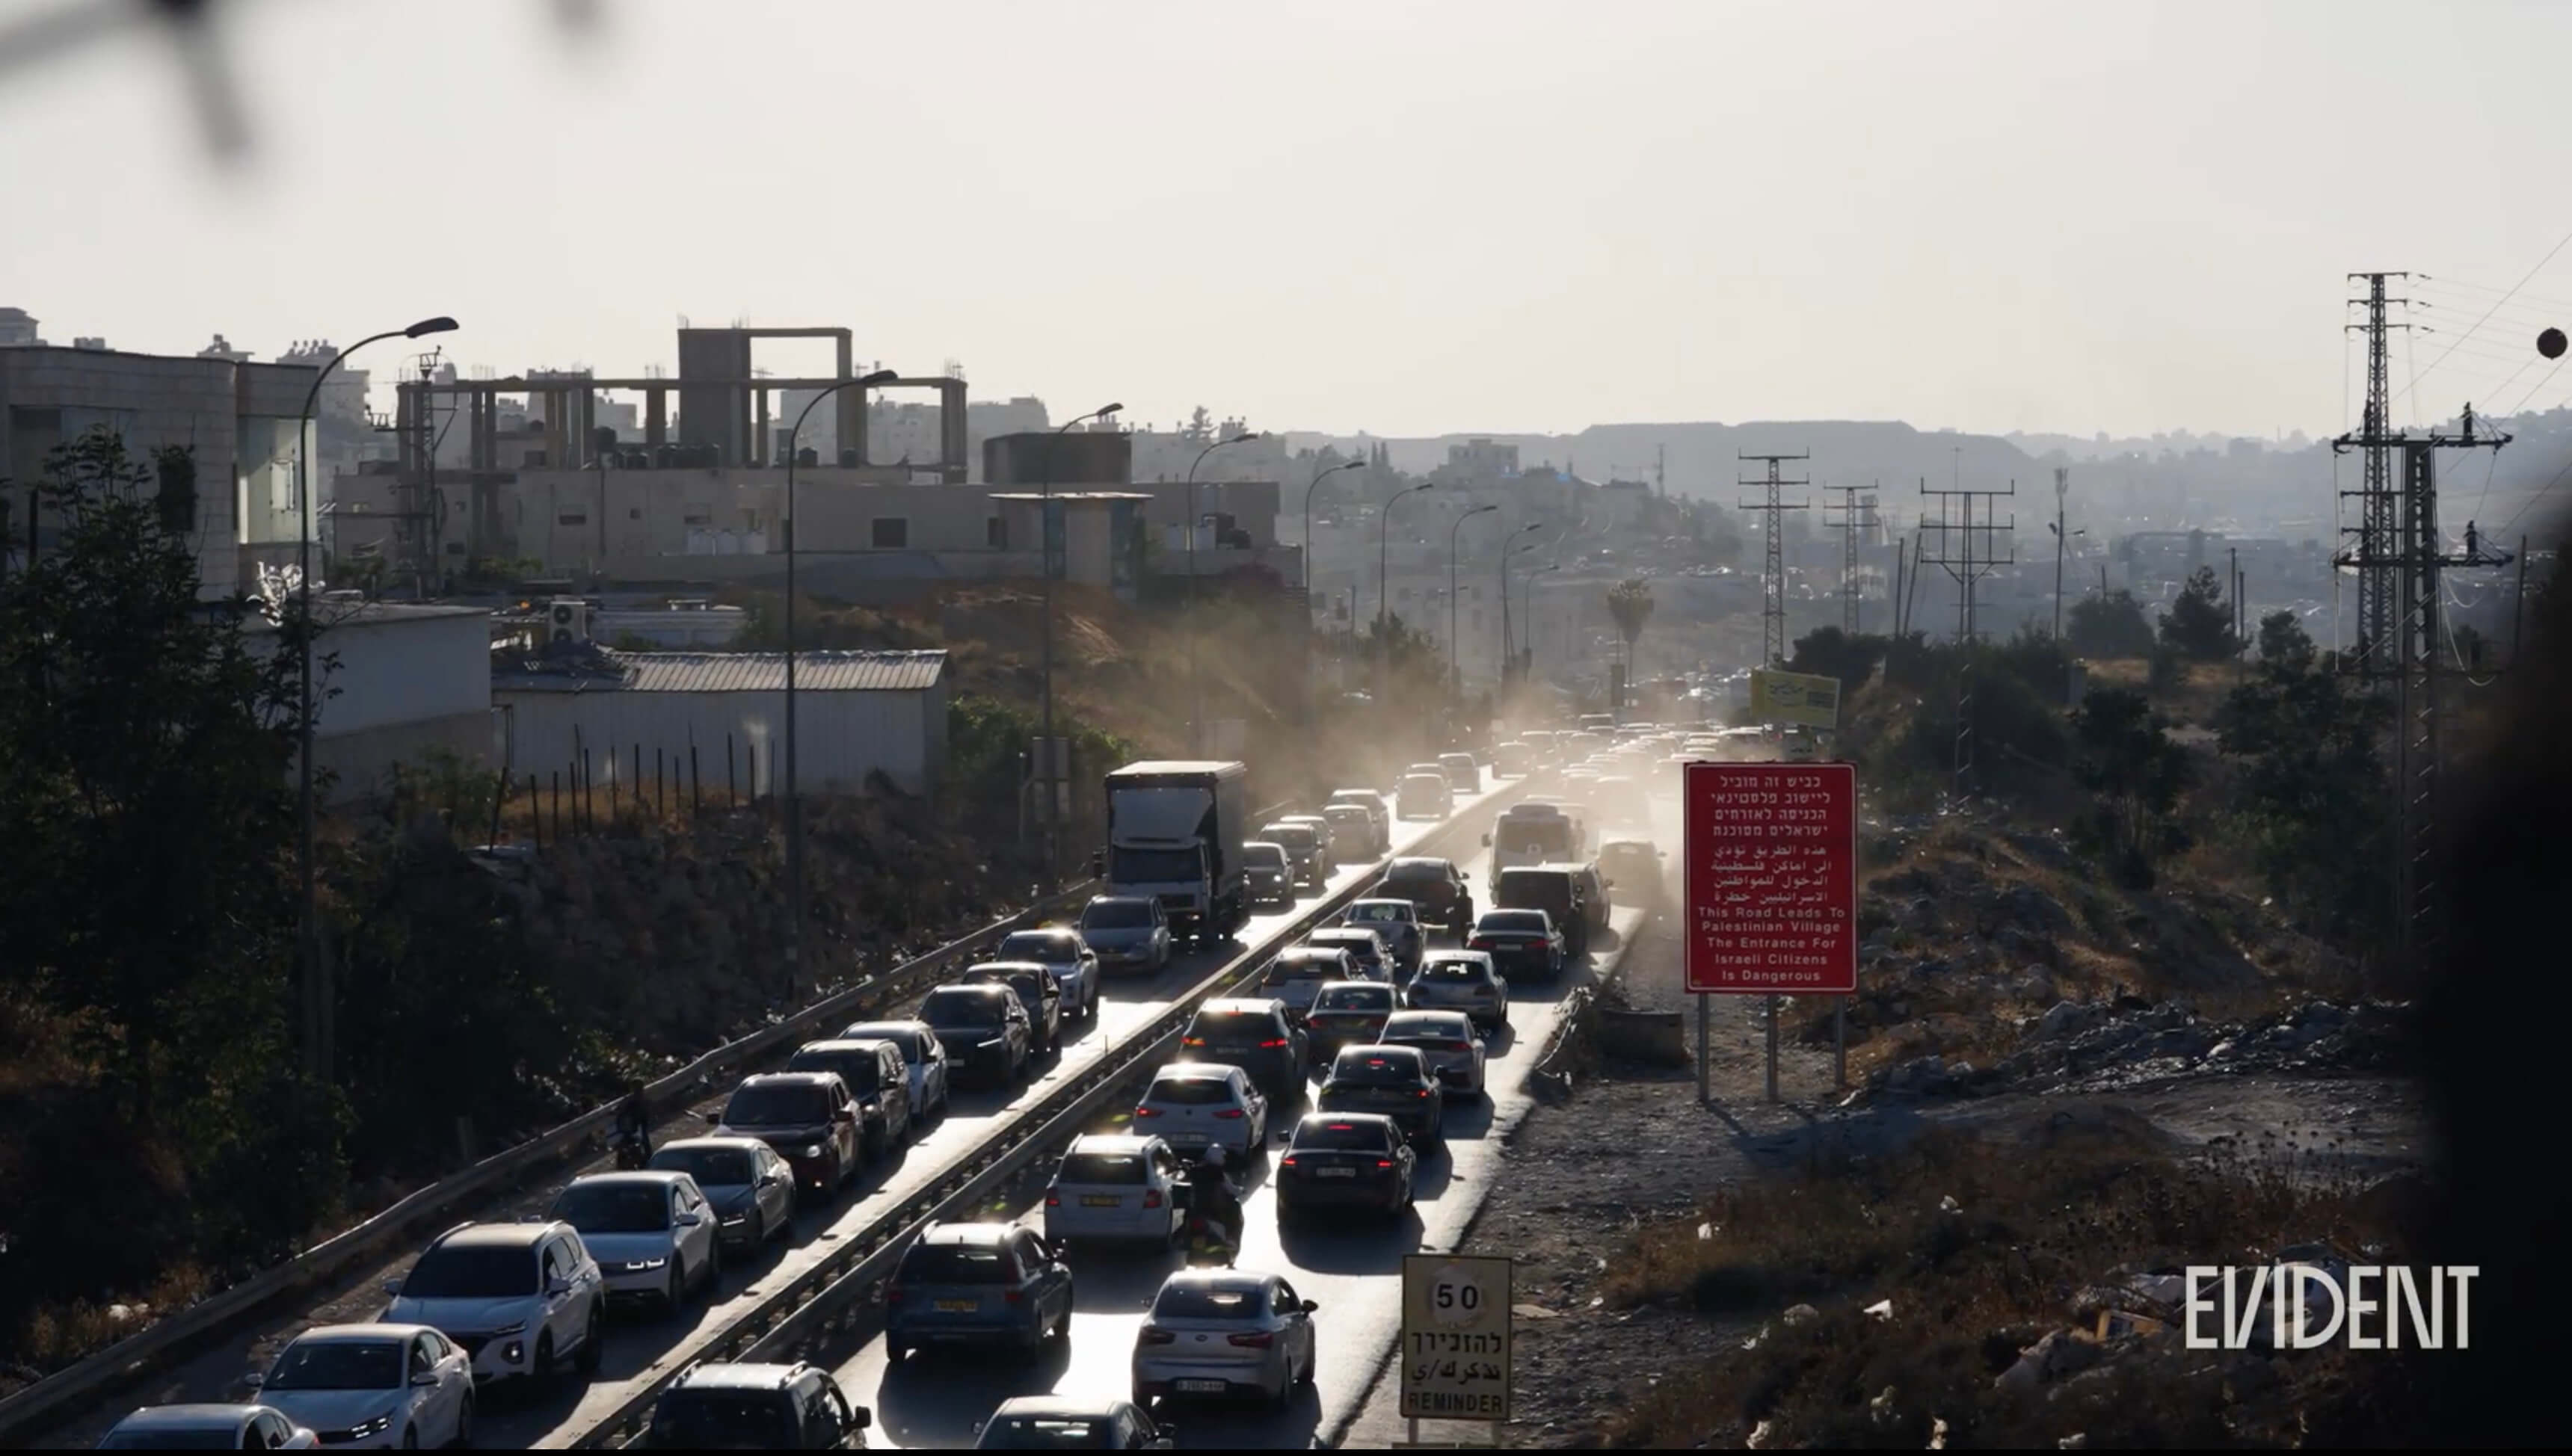
Across the West Bank, an expanding system of checkpoints, gates and blocked roads has suffocated life for Palestinians. Our investigation, with ARIJ (the Arab Reporters for Investigative Journalism), the Palestine Reporting Lab, and WIRED, examines how this infrastructure enforces apartheid and reshapes movement. The checkpoint system’s restrictions block or slow access to work, healthcare and education, and erode family and social ties that connect Palestinian society.
To measure fragmentation, we broke the problem into practical questions. Where do people live, and which hospitals, universities and major cities do they need to reach? Which roads can they take, and which obstacles stand in the way? When are checkpoints open, closed or congested? And how much longer do journeys take as a result, and which journeys become impossible altogether?
In most places in the world, obtaining the data to answer these questions would be fairly simple. A census shows where people live. Government websites might list the locations of hospitals and universities. Google Maps usually provides a plausible route of how to get from point A to point B, estimates how long it will take and flags obstacles and traffic that drivers might encounter along the way.
In the West Bank, it’s much more complicated. A route shown on a map might not be available to Palestinians. Checkpoints open and close unpredictably, forcing long detours, none of which are captured in publicly available data. No single source showed how these different restrictions combine to shape the journeys Palestinians actually make.
We spent eighteen months building that picture ourselves. We verified the locations of checkpoints and other barriers, tracked when they opened and closed using crowdsourced reports from Palestinians and analyzed billions of GPS readings to map and measure the routes drivers actually use. We also ran two large surveys, conducted in collaboration with The Institute for Social and Economic Progress, that asked hundreds of Palestinians about their travel, how their movement has changed since October 2023 and what they face on the road.
Together, this allowed us to measure how the lives of 3.5 million Palestinians are shaped by an infrastructure that fragments the West Bank and controls how they move through it. Our analysis enables us to understand how control at a handful of checkpoints can reshape movement, influence decisions about whether and where to travel and isolate communities.
Our analysis reveals persistent patterns of severe obstruction to movement, showing how checkpoints enforce an apartheid system. We found that:
- An increasing number of checkpoints stand between communities and essential services. One in five West Bank communities had at least one more checkpoint on the most direct route to a hospital in 2025 than in 2023. As a result, a third of West Bank communities now cross at least three checkpoints to reach a hospital.
- Checkpoint closure patterns are highly unpredictable, and sometimes sweeping. During the 12 day war with Iran in June 2025, around 70% of checkpoints were closed, effectively bringing life in the West Bank to a standstill.
- Waits at checkpoints have grown. Average delays have increased by more than 50% after October 2023, from under 10 minutes to about 15, with waits frequently exceeding hours at a time.
- Detours cost commuters about 90 minutes each week. The average West Bank commuter loses about an hour and a half each week to longer, roundabout routes taken to avoid checkpoints. Over the course of a year, this additional travel time amounts to 77 hours lost per commuter — the equivalent of nearly two full work weeks spent navigating roadblocks instead of getting where they need to go.
- Across the West Bank, Palestinians collectively lose about 30 years of time every day. The cumulative figure shows how additional travel time adds up to a substantial loss across the population.
The burden extends beyond time lost on completed journeys. In our survey, 79% of respondents said their movement had decreased since before October 2023, and 69% reported cancelling social or family visits because of checkpoints. Our time-loss estimates cover journeys people still make, not those that are cancelled or abandoned. The time-loss estimate therefore does not capture the social, economic or personal cost of foregone travel.
Our analysis draws on five main sources.
| Primary Data Sources | |
|---|---|
| Source | Description |
| OCHA Movement obstacle lists | UN OCHA’s lists of checkpoints, gates and roadblocks from 2023 and 2025. We verified the locations using satellite imagery and reporters on the ground. |
| Basma Radio | A Telegram channel where users post updates on checkpoint conditions. We collected more than 60,000 status reports and matched them to 120 checkpoints to track when each was open, closed or congested. |
| Mapngin | A Palestinian navigation service that routes drivers along roads they can actually use. We used it to map routes from communities to hospitals, universities and other governorates. |
| GPS Data | 2.6 billion location readings from vehicles given to us by a private logistics company. The pings cover a period from January 2018 to November 2025 and allow us to measure how long drivers wait at checkpoints and how much longer journeys take. |
| ISEP Surveys | Two surveys, conducted with the Institute for Social and Economic Progress, of over 500 Palestinians each about their travel movements, what they experience at checkpoints and how movement obstacles affected their lives. |
Mapping checkpoints and tracking when they close
Building an accurate map of checkpoints
Before we could measure how checkpoints affected travel, we needed an accurate map of where they are and a record of when they are open or closed.
We decided to use a movement obstacle dataset from OCHA, the UN’s humanitarian coordination office, as the basis for our analysis. It provided the most comprehensive public record we identified, as well as snapshots from 2023 and 2025 that allowed us to measure how checkpoint infrastructure changed after October 7. The 2025 list contains 849 movement obstacles, broken down by “Closure Type,” including:
248 checkpoints or partial checkpoints;
270 road gates and barriers;
116 road blocks;
215 earthmounds, earthwalls and trenches.
This dataset is not perfect. Many of the locations are slightly off and a few obstacles appeared to be duplicates. Getting the location of obstacles exactly right is crucial to our analysis. To count how many checkpoints someone passes on a trip, we check whether their route runs through each checkpoint on the map. If a checkpoint is incorrectly marked even a few meters off the road, the route will miss it, resulting in an incorrect count.
We therefore checked the location of every checkpoint in the dataset. We did extensive work using satellite imagery and asked on-the-ground colleagues at the Palestine Reporting Lab and ARIJ to verify and, where necessary, correct the location of all checkpoints on this list and remove likely duplicates. Finally, we also matched the 2023 OCHA checkpoint list to the verified 2025 list to see how many new checkpoints had appeared on drivers’ routes since October 7.
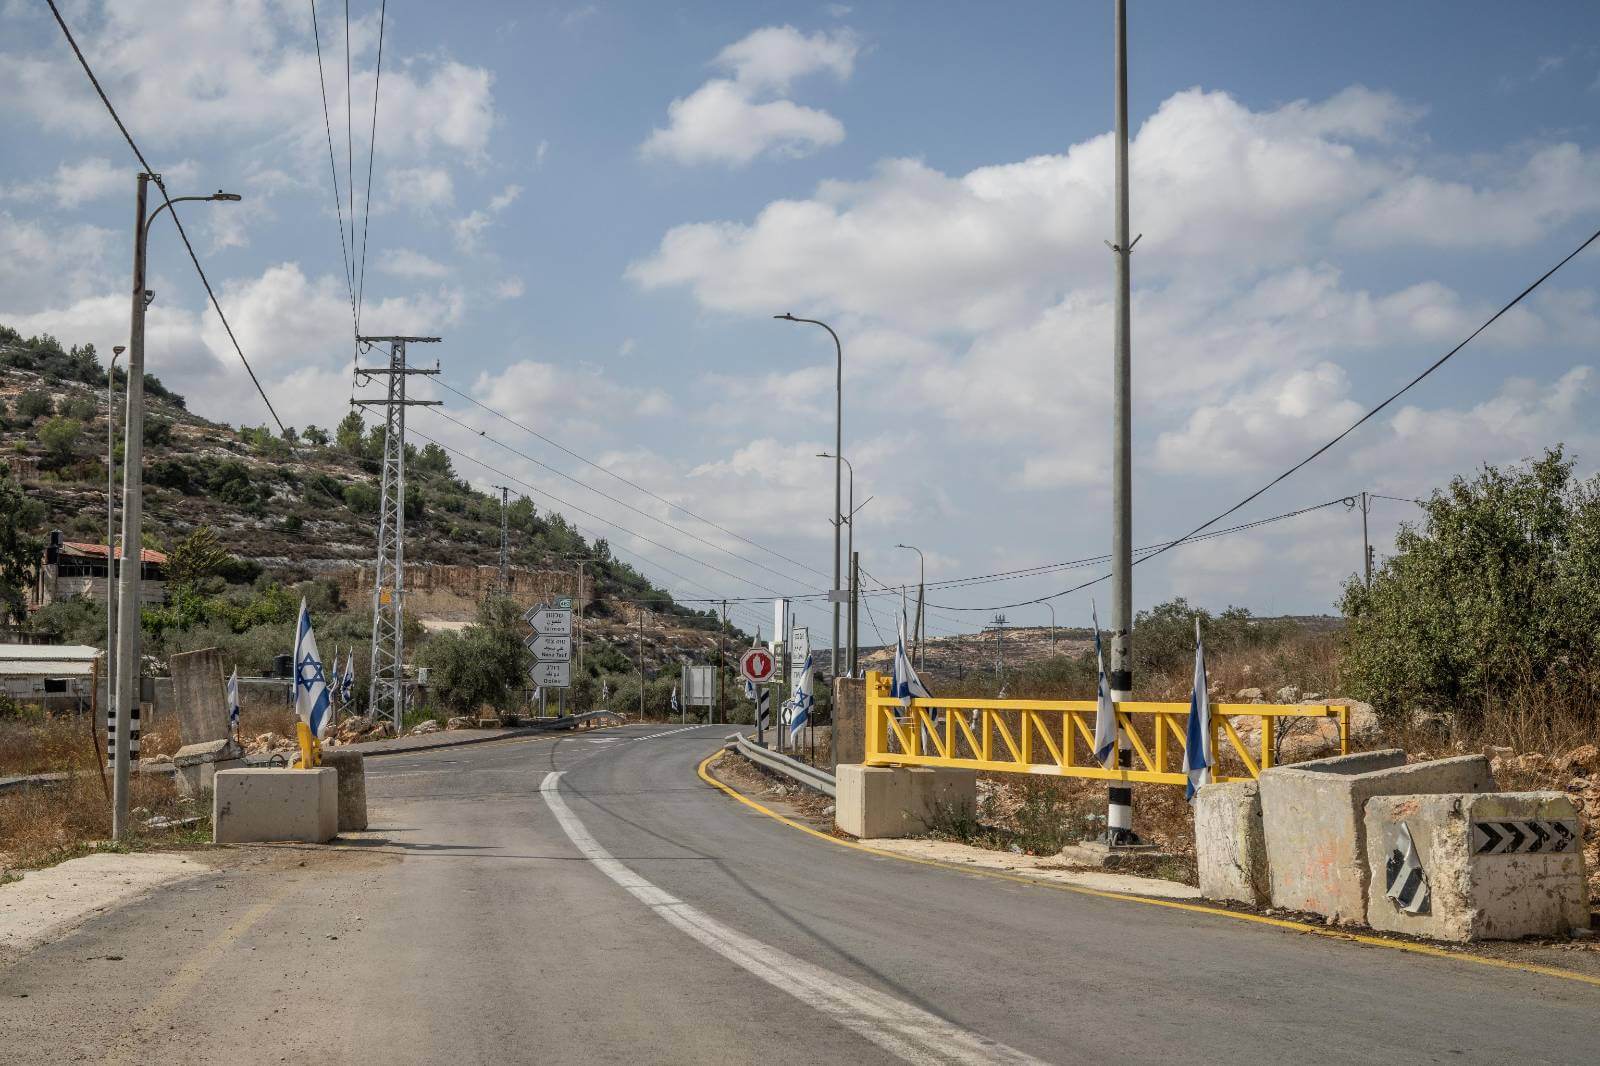
We differentiated checkpoints, which can be opened or closed, from permanent obstacles that physically block a road. Earthmounds, earthwalls, trenches and roadblocks were therefore excluded from figures such as the number of checkpoints on a route. However, these obstacles remain an important part of the broader analysis: by closing off roads entirely, permanent obstacles determine which roads are available and can funnel traffic onto the remaining roads controlled by checkpoints.
Tracking closures through user-generated Telegram data
The geographic data established where checkpoints and other obstacles were located. To make sense of how they impact Palestinians’ lives, we also needed to track how conditions at checkpoints changed over time, including whether they were open, closed, congested or restricted.
No official source tracks this. Instead, most Palestinians have turned to crowd-sourced information about checkpoint closure and congestion. In our survey of 550 Palestinians conducted with ISEP, more than 70% said they use social media to stay up-to-date on checkpoint closures and 33% reported using Telegram specifically.
We scraped and analysed more than 60,000 messages from Basma Radio – a Telegram channel that provides updates, often multiple times an hour – communicating which checkpoints are open and closed. This channel went live on October 7, 2023 and has 14,000 users. We matched 120 checkpoints appearing in Basma Radio reports to checkpoints in OCHA's data, using a combination of automated methods and extensive manual review. This allowed us to map Basma Radio’s status reports across the West Bank.
For each checkpoint that appeared in more than ten Basma Radio messages in a given month, we calculated the rate at which it was marked as open, closed, congested or restricted.
This is an imperfect measure of a checkpoint’s status for three reasons. First, we did not independently verify Basma Radio’s messages. Secondly, reporting frequency varies substantially between checkpoints and over time. Updates may be more frequent for more heavily-travelled checkpoints and when conditions change. Finally, each message reflects a checkpoint’s status at a particular point in time, without establishing exactly how long that status lasted. For example, a message may indicate that a checkpoint is closed at 9 a.m. But the same checkpoint could reopen ten minutes later without an update in the Telegram channel.
Analyzing Closure Data
Our analysis of Basma Radio’s user reports showed that checkpoint closures are often unpredictable. Some checkpoints follow no regular pattern by time of day or day of week, making it hard to plan ahead. But at times, multiple checkpoints get closed around the same time, seemingly in response to political events. For example, in the initial days of Israel’s 12 day war with Iran in June 2025, around 70% of checkpoint status updates reported closures compared to less than 20% in the weeks prior.
By combining the corrected OCHA data with Basma Radio’s status reports, we were able to investigate how obstacles are used to control movement in the West Bank.
We found that the placement of movement obstacles throughout the West Bank follows a few distinct patterns. In Hebron, a major city in the southern West Bank, 30 kilometres from Jerusalem, movement obstacles are used to control access to individual neighborhoods or even buildings. In rural areas, permanent barriers such as earthmounds block most roads into a town or village, funneling all traffic onto a single access road controlled by a checkpoint.
This system allows the Israeli military to seal off an entire community by closing a single checkpoint. Take Sinjil, a town northeast of Ramallah. It is situated close to Route 60, the main artery of the West Bank. There are six access roads connecting Sinjil and Route 60. Only one entry point was passable at any point in time since October 7, with all remaining roads barred with earthmounds. Even the checkpoint on the sole passable road has been closed at times. In October 2024, more than 40% of Basma Radio status updates about Sinjil’s checkpoint reported it closed. While drivers can exit Sinjil to the West, entering an intercity road also requires passing through checkpoints.
As the next section shows, the same logic that isolates a town like Sinjil also operates at the scale of whole regions.
Defining and routing representative trips
Rather than attempting to model every possible journey, we set out to construct a set of trips that reflect destinations that people need to reach in daily life, such as healthcare and education facilities and major cities in other governorates.
Building trips from lived geographies
Our analysis measured two types of trips. The first kind stays within each governorate where each locality serves as an origin and essential services as destinations. We used OCHA’s community-level dataset to identify the localities used as origins and their locations. Hospital locations came from data compiled by the Palestinian National Institute of Public Health and UNRWA, the UN agency that supports Palestinian refugees. For universities, we picked a major university in each governorate that has one, using a ranking website called UniRank. We then manually verified the locations and cross-checked them with our colleagues on the ground.
These trips represent a basic expectation of mobility: the ability to reach essential services locally, as well as the main towns where services, jobs and administrative life are concentrated. They allow us to measure whether those connections remain available as checkpoint restrictions change.
The second kind of trip runs between governorates. We measured routes between the 11 West Bank governorates, using governorate capitals as both origins and destinations. These journeys may serve professional and administrative ends, but travel to other governorates can also be essential to a community’s ability to maintain ties with friends and family members. Together, these local and inter-governorate journeys give us a system level view of how well different parts of the West Bank remain connected.
Building routes Palestinians can actually use
For each trip defined above, we needed a route that Palestinians would plausibly take.
This posed a fundamental challenge. The most commonly used mapping services, like Google Maps and Open Street Maps, did not reflect the realities of travel barriers faced by Palestinians, including roads reserved for Israeli-plated cars, roads that lead to settlements and permanent barriers. We therefore decided to use Mapngin, a Palestinian mapping service provider that helps Palestinians find passable routes through the West Bank.
For every representative trip, we sent the origin and destination coordinates to the Mapngin API and requested the fastest available route. We retained the full route geometry, distance and estimated duration returned by the service. These became our baseline routes, a set of journeys connecting communities to hospitals and universities within their governorate, and governorate centres to one another.
We then checked which checkpoints each baseline route passes through. This gave us a count of the checkpoints encountered on each journey. Because we used the same routes with both the 2023 and 2025 checkpoint lists, we could see how many checkpoints had been added along each route over those years.
Simulating General Checkpoint Closures
The baseline routes describe journeys under favourable conditions, with no checkpoint closures imposed, but we also wanted to examine how closures could reshape these journeys. So we ran a simulation in which we generated a second set of routes that avoided 35 checkpoints Basma Radio reported as closed or congested in at least 30% of updates.
For each trip, we then compared the new route, which avoided these checkpoints, with the baseline route. We looked at how much longer it was, which new checkpoints it passes through and whether the route was still possible at all.
Findings
More checkpoints now stand between Palestinians and essential services. Comparing the same baseline routes against the OCHA 2023 and 2025 checkpoint datasets showed that one in five West Bank communities had at least one or more checkpoints on its most direct route to a hospital in 2025. As a result, a third of West Bank communities now cross at least three checkpoints to reach a hospital.
Some checkpoints control access to a single town, as in Sinjil, described above. Other checkpoints work at a much larger scale. Their position in the road network gives them control over travel between whole regions of the West Bank. Journeys from the southern West Bank towards the centre and north converge at Wadi an Nar. Basma Radio rarely reported it closed, only 0.5% of updates, though it was congested in 16% of them. But when we simulated its closure, none of those journeys could be completed. This single chokepoint can effectively divide the West Bank in two.
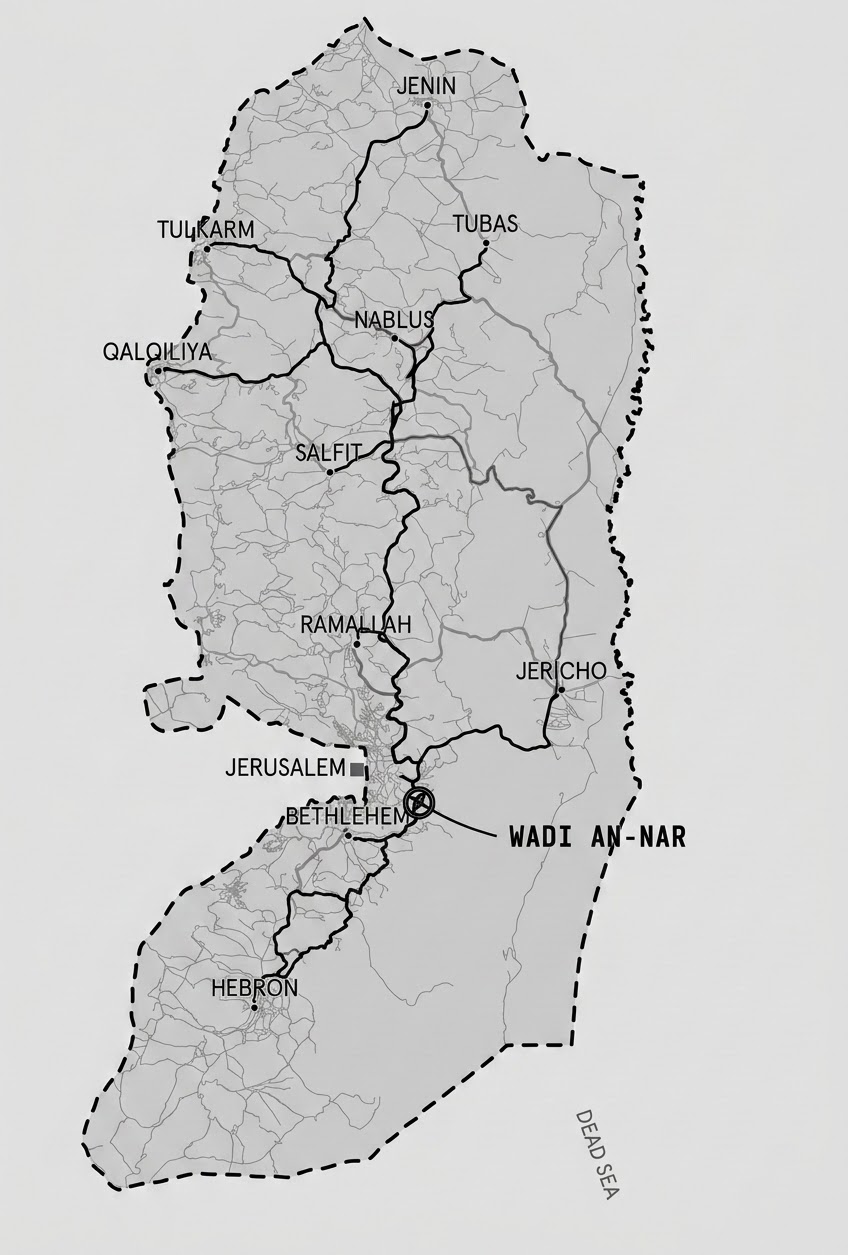
Two checkpoints, Jaba and Bet El DCO, play a similar role between the Ramallah area, East Jerusalem and the Southern West Bank. Basma Radio reported Jaba closed in 1.5% of updates and congested in 30.6% and Bet El DCO closed in 54.8% of updates and congested in 5.5%. When our simulation avoided both, the route from Ramallah to East Jerusalem had to route north through Ein Siniya before turning back south, in the intended direction. The detour adds about 32 kilometres and extends the trip from 35 minutes to 54 minutes.
These cases show how control at one or two points can reshape movement across an area far larger than the checkpoint itself. Closing a local entrance can leave a community with a single, controlled exit. Closing a checkpoint on a major road can reroute or cut off travel entirely between governorates.
Estimating waiting times
We obtained access to a massive trove of user-generated traffic data from a private logistics company. The company asked not to be named because of potential retribution from the Israeli Occupation.
This dataset contains around 140GB worth of user-generated location data from January 2018 to November 2025. In total, it includes more than 2.6 billion pings. Each row contains a vehicle ID, event time (at the second level), latitude, longitude and vehicle speed in kilometres per hour (km/h). Usually, there is one ping every 30 seconds or every minute. It is important to note that these users are not a representative cross-section of Palestinian society; the logistics company works primarily with commercial, NGO and government clients.
Detecting when a vehicle is waiting at a checkpoint
A key challenge in analyzing the GPS data was parsing when a car is actually waiting at a checkpoint.
First, we established when a vehicle is close to a checkpoint. Around each checkpoint polygon, we defined an 800 meter outer radius. This outer radius is the region in which we “pay attention” to whether a vehicle may be in line to a checkpoint. To actually qualify as having ‘reached a checkpoint a vehicle must have a ping inside the checkpoint polygon itself. The data contains more than 5.8 million such checkpoint encounters.
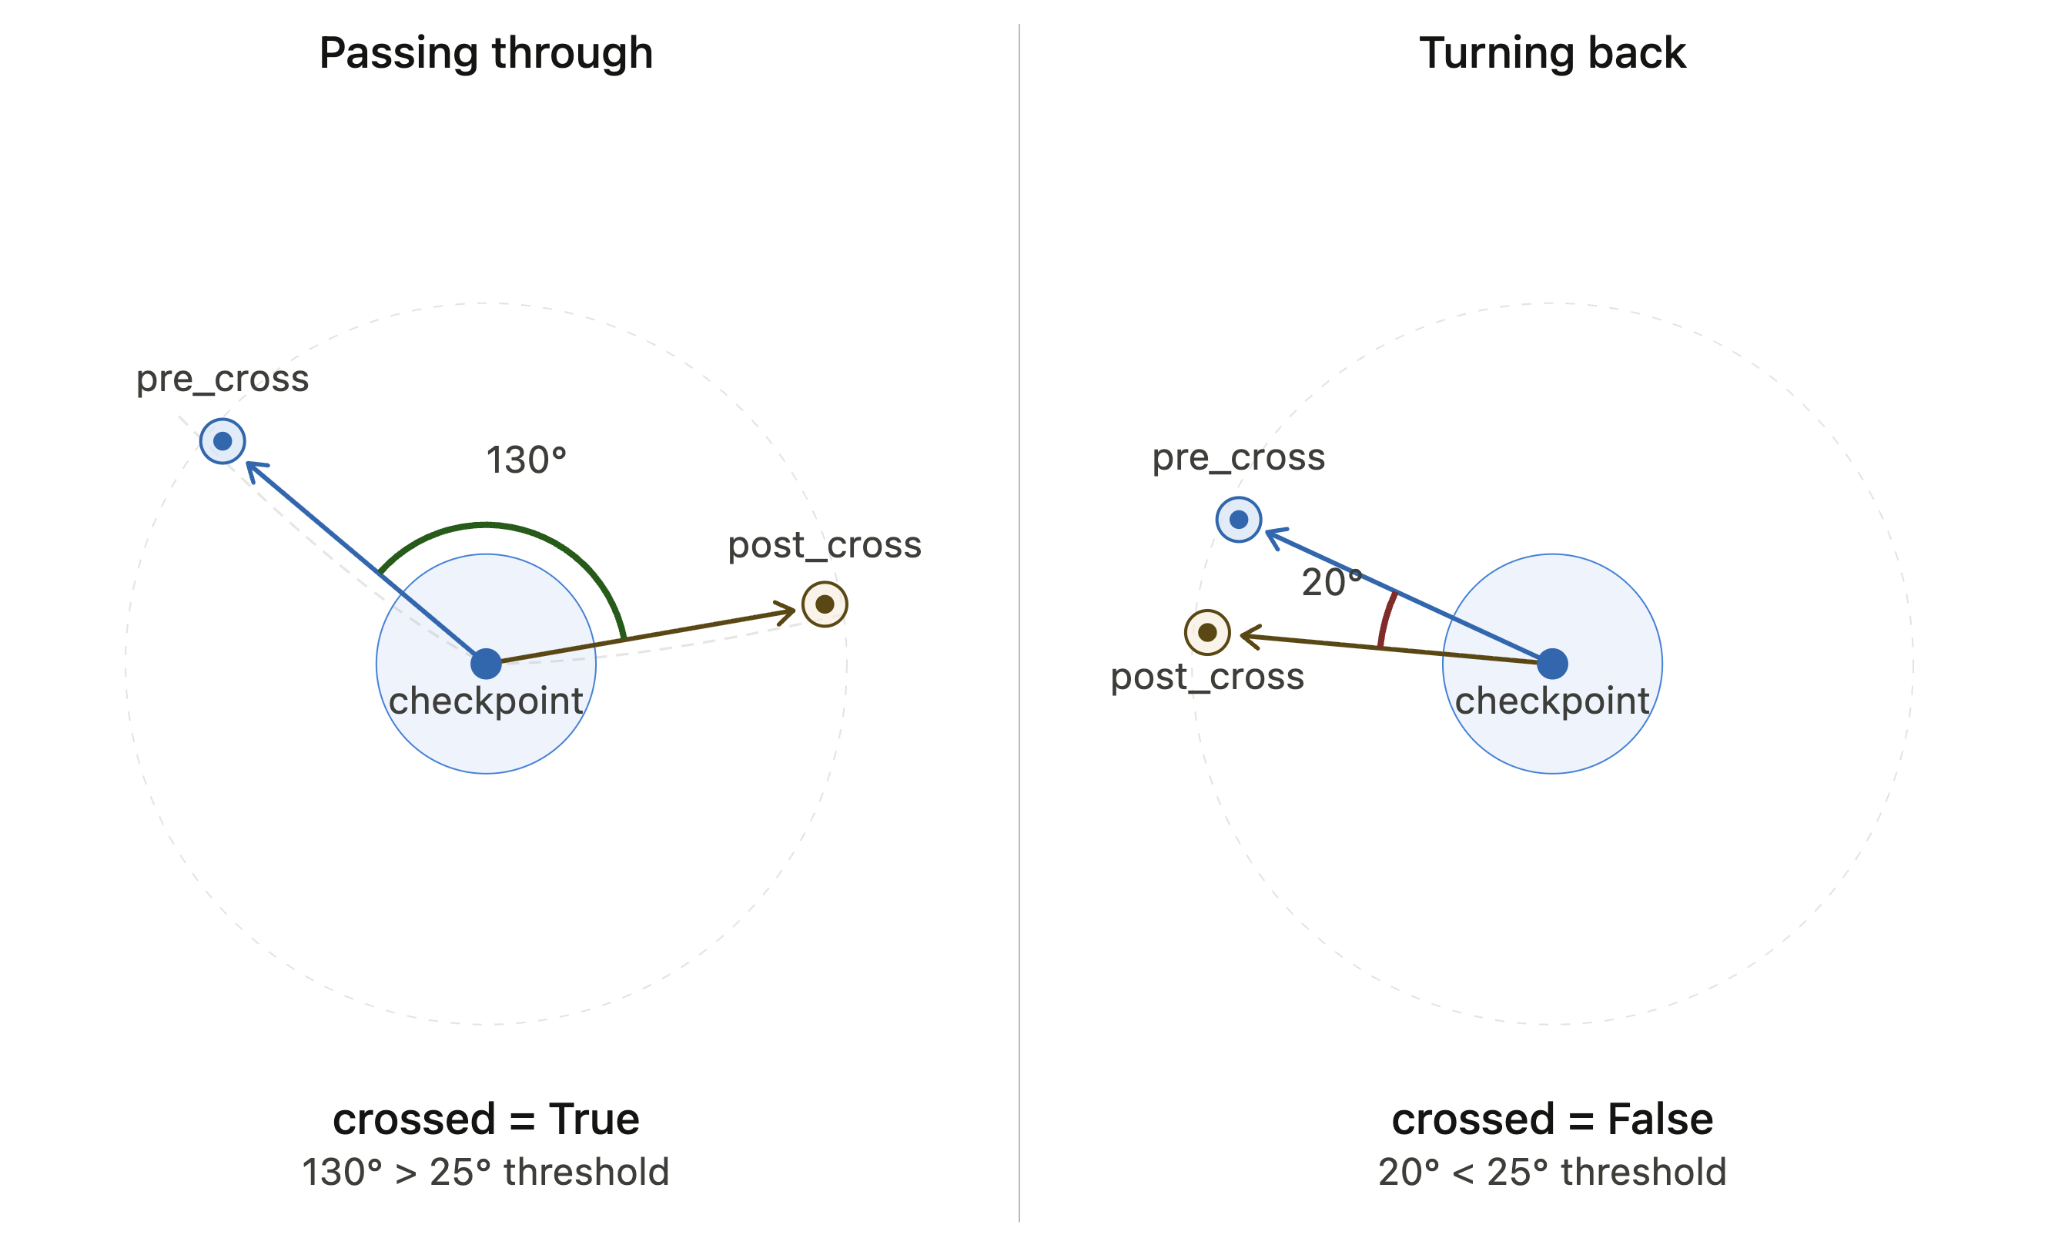
Next, we established whether the car actually passed through the checkpoint. Not every checkpoint encounter is actually a vehicle standing in line waiting to cross. Some vehicles may not cross, either because the checkpoint is closed or because it simply had some business directly at the checkpoint. To determine whether a vehicle crossed a checkpoint, we use the angle between the checkpoint and the first ping directly before and directly after the vehicle entered and exited the checkpoint polygon. If the angle exceeds a threshold of 25 degrees, we consider the vehicle to have crossed the checkpoint.
Finally, we calculated how long each vehicle spent waiting at the checkpoint. When the vehicle is inside the 800 meter radius, it may not be waiting to cross the entire time. On the one hand, the checkpoint could be open and the vehicle simply passes through. On the other hand, even if the vehicle is stationary prior to passing the checkpoint, it may stop for reasons unrelated to the checkpoint and then speed up again before passing a checkpoint. We therefore counted as waiting time any consecutive GPS pings before the crossing, where the car was moving slower than 20 km/h.
We arrived at the 800 meter, 25 degree and 20 km/h thresholds based on extensive visual verification. In choosing those cutoffs, we weighed a tradeoff between minimizing false positives, counting delays unrelated to the checkpoint, and false negatives, wrongly excluding delays clearly related to a checkpoint.
Waiting Time Findings
For each checkpoint, we calculated two monthly averages: crossing time, across all crossings, and how long cars waited when they were delayed by at least two minutes.
We found that average delays rose by more than half after October 7, from under 10 minutes to about 15. The clear break in the data on October 7 is striking. Much of this increase is caused by longer delays in Nablus governorate.
We then matched these delays to the routes that cross through each checkpoint, allowing us to estimate the direct waiting time associated with different journeys. Using this matched dataset, we computed route level statistics: total delay time, delay per kilometer, and percent delay time (share of total travel time due to delay).
Checkpoint delays increase travel time to universities and hospitals, especially after October 7 —but the delays are modest. Prior to October 7, checkpoint-related delays averaged two to five percent of travel time. After October 7, they increased to five to 10%. These results are distributed unevenly geographically and are mostly driven by Nablus, where delays approximately tripled.
We also calculated delay time a second way, using our survey of 601 Palestinians across the West Bank. Respondents told us how often and how far they travel. Combining their answers with the checkpoint delays we measured, we calculated how much time a typical person spends waiting at a checkpoint each week. This results in an average wait of less than a minute per week.
That may seem surprisingly low. There are two reasons. First, while the data contains thousands of cases where cars waited hours, these very long waits represent a small share of all checkpoint crossings. Second, both approaches, measuring delays on “primary routes” and combining delays with the travel patterns reported in the survey, share the same assumption. They assume that checkpoints are passable and that drivers always opt to go through checkpoints when they are on the most direct route. In reality, more than 70 percent of people in our survey reported taking detours to avoid checkpoints. That means when someone drives an extra thirty minutes to get around a checkpoint, that time does not show up as a delay in these approaches.
It is important to note that the impact of checkpoints goes beyond making routine journeys slower. Palestinians regularly report being subjected to violence and coercive interactions at checkpoints. According to our poll, when asked about the type of interaction they faced at checkpoints in just the past 6 months, 20.3% of respondents reported having their vehicles searched, 13.8% had their phone searched, 10.8% had their body searched and 7.2% had a weapon pointed at them. Several respondents reported being assaulted.
These experiences, combined with the uncertainty of checkpoint closures and delays, explain why many Palestinians may take long detours to avoid checkpoints. As the next section explains, tracing these circuitous routes allows us to estimate how much time Palestinians are losing due to checkpoints.
Estimating excess journey time
Most of the time Palestinians lose to checkpoints is spent avoiding them. A closure may force a driver onto a much longer route, and uncertainty about which checkpoints are open can change the route a driver takes before reaching one at all. To capture this wider effect, we used the same GPS dataset to measure how much longer trips between towns and cities take than they could.
The GPS data is a stream of location coordinates, not a list of trips, so we first had to reconstruct individual journeys. A journey is considered over when there is a gap of more than ten minutes between two recorded points or when the vehicle remains in place for more than ten minutes. For each journey, we then identified the towns and cities it passed through, treating each locality-to-locality leg — which we refer to as an origin-destination pair — as a separate journey. Each leg began and ended at the point where the vehicle came closest to the locality centre.
To compare journey times reliably, we needed repeated journeys between the same places and rules to remove journeys that were likely incomplete or affected by GPS errors. For the final analysis, localities needed a population of at least 5,000 and origin-destination pairs needed to be at least 2 kilometres apart. Each pair also needed at least 20 observed journeys. Quality checks removed journeys whose observed distance was less than 80% or more than ten times the straight-line distance between the two localities.
Establishing a reference journey time
Travel time between the same two localities varies considerably. To measure this variation consistently, we established a reference journey time separately for each origin-destination pair, in each direction.
We set the reference journey time to whatever is slower between the fastest 3% of journeys or the second fastest trip we recorded. This reference time represents a journey time that we know was achievable under relatively favourable conditions after October 7, 2023. Using the second-fastest journey as a floor also removes the influence of a single unusually fast GPS observation.
We calculated how much extra time each journey took by subtracting the reference journey time from the observed journey time. We then calculated two measures of additional journey time. The median excess time, which reflects a typical journey, and the average excess time, which is more sensitive to the unusually long delays that make travel time particularly unpredictable. We use the average for most of the aggregate estimates that follow. Long, repeated delays are part of the burden we are trying to capture, and the average preserves their contribution rather than smoothing them away.
Matching journeys to how Palestinians report traveling
The analysis described above tells us how much longer trips take, but it doesn’t tell us how often Palestinians make them. In order to answer that, we turned to our survey of 601 Palestinians. We asked respondents how often they had travelled over the previous two weeks to three broad destination types: another town or city within their governorate, their governorate centre and another governorate. Respondents also reported the approximate distance of those journeys.
To connect the two datasets, we grouped the GPS origin-destination data into the same governorate, journey type and distance categories. Each kind of trip a respondent reported in the survey could then be matched to similar journeys in the GPS data and be given an excess time estimate. For example, say a respondent reported making four trips of roughly 20 to 50 kilometres to another governorate over the previous two weeks. We could look at GPS journeys between the same governorates over a similar distance, take their average extra time and count it four times.
We treated the distances respondents reported as one-way journeys. For each respondent, we multiplied the estimated excess time for each journey type by their reported number of trips and summed the results across the two-week period. We report results for all respondents, “travellers” reporting at least one trip and “commuters” reporting at least five trips.
To aggregate excess journey time across localities, we weighted them by population. We first estimated extra travel time for each origin locality based on its journeys to destinations observed in the GPS data. We then weighted origin localities using OCHA 2017 population figures, giving larger communities more influence over the final estimate.
Validation and findings
We tested the analysis across alternative weighting methods, trip-frequency assumption, distance interpretations, locality matching rules and journey-quality thresholds. These tests showed that our results were robust to different parameters and where the results were most sensitive to methodological choices. This process also helped to identify our final specification.
We also compared our GPS travel estimates with what respondents told us in the survey where possible. For respondents where we could calculate both measures, the results were:
| Extra travel time over two weeks (minutes) | All | Travelers | Commuters |
|---|---|---|---|
| GPS Estimate | 66 | 111 | 180 |
| Self-reported | 92 | 154 | 226 |
The two sources converge as travel frequency increases, providing an independent check on the scale of the GPS-derived estimates. The consistently higher survey figures may also reflect negativity bias in self-reported estimates. Particularly disruptive journeys may be more memorable to respondents and given greater weight in their perception of time. Some divergence between the GPS and survey-based measure is therefore not surprising.
Our excess travel estimates capture only one part of the true burden Palestinians experience. They describe journeys people still make, at the frequency respondents currently report making them, including people who travel infrequently. The same pressures described above, violence at checkpoints, unpredictable closures and long delays, can lead people to reduce their travel or stop making some journeys altogether. Journeys that are cancelled or no longer attempted contribute no travel time at all.
The time-loss estimate therefore cannot capture the social, economic or personal cost of foregone travel. This matters in a context where 79% of survey respondents said their movement had decreased since before October 2023 and 69% reported cancelling social or family visits because of checkpoints.
Averages inevitably smooth over very different experiences across the West Bank. On some routes, people who travel regularly lose far more time. For example, travel from Ramallah to Al-Eizariya, on the edges of Jerusalem, has a reference duration of 48 minutes in our GPS data. On average, drivers spent 52 extra minutes on the road, more than doubling the trip.
Someone making that journey eight times a week, four roundtrips, would therefore accumulate nearly seven hours of additional travel time. The comparable figure is about five and a half hours a week between Ramallah and Nablus and more than 12 hours between Ramallah and Hebron.
Extra travel time from Ramallah across the West Bank
Average GPS-observed excess journey time from Ramallah to destinations across the West Bank, compared with the reference time for each route.
| Destination | Reference time (min) | Median journey time (min) | Average excess time (min) | Extra time as % of reference | Extra time over eight journeys |
|---|---|---|---|---|---|
| Al 'Eizariya (East Jerusalem) | 48 | 86 | 52 | 109% | 6h 59m |
| Hebron | 113 | 194 | 91 | 81% | 12h 11m |
| Bethlehem | 70 | 115 | 52 | 74% | 6h 56m |
| Salfit | 52 | 72 | 38 | 74% | 5h 7m |
| Tulkarm | 90 | 130 | 65 | 72% | 8h 38m |
| Nablus | 67 | 102 | 42 | 62% | 5h 34m |
| Jericho | 53 | 76 | 32 | 60% | 4h 14m |
| Qalqiliya | 84 | 110 | 37 | 44% | 4h 58m |
| Tubas | 95 | 126 | 38 | 40% | 5h 6m |
| Jenin | 111 | 145 | 44 | 40% | 5h 51m |
When neighbouring communities become far apart
Some of the clearest examples of excess travel time involve shorter journeys. Anabta and Beit Lid are neighbouring communities in the Tulkarm governorate, in the north-western West Bank, that are about an eight kilometre drive apart. Under favourable conditions, we observed journeys between them taking around ten minutes. On average, though, journeys took 39 minutes longer. Someone travelling between the two communities eight times a week would lose more than five hours. The geography of those journeys also changed. The direct connection runs through an area around Road 557 and the Einav settlement where movement is constrained by the Anabta/Einav checkpoint. The Basma Radio Telegram channel reported that the checkpoint was closed more than two-thirds of the time and congested in more than ten percent of reports. Several permanent obstacles also block the area. In December 2023, settlers established an illegal outpost, Nofei Elhanan, on the hill just north of Beit Lid.
Over time, drivers in the GPS data travelling from Anabta towards Beit Lid increasingly began by heading away from their destination, either west towards Tulkarm or east towards Nablus, before looping back towards Beit Lid. In the final six months of our data, from June to November 2025, the fastest journey we observed between the two communities was 35 minutes, for what used to be a ten minute journey.
As a result, the number of journeys between the two communities appearing in our GPS data fell sharply. Between October 7 and November 29, we recorded 76 journeys between the two towns in 2023, 14 in 2024 and just eight in 2025, even though the total amount of GPS data grew by 57% over those years.
Because the vehicles in our dataset are not representative of all Palestinian travel, we use these counts only to describe how frequently this particular connection appears within our data. Together with the changing routes and journey times, they show travel between neighbouring communities becoming progressively harder, to the point where people appear to give up on making the journey.
Anabta-Beit Lid is not an isolated case. Other short journeys in our data show similar patterns. Ar Rihiya and Dura, in the Hebron governorate, are six kilometres apart with a 14-minute reference journey, but the average excess journey time was 21 minutes. Balata Refugee Camp and Beita are eight kilometres apart, with a reference time of 19 minutes and an average excess time of 44 minutes. Between Beit Kahil and Sa’ir, ten kilometres apart, the reference was 22 minutes and the average excess time was 57 minutes.
Simply put, these neighbouring communities remain just as close on the map, but the roads people can actually use have made them much farther apart in practice.
Limitations and assumptions
Matching checkpoints across datasets
Extensive efforts were made to verify checkpoint locations and match them over time and across datasets. Nonetheless, some uncertainty remains because checkpoint locations can change and the same checkpoint can be referred to by different names.
We were also unable to verify the exact locations of checkpoints inside dense urban areas, especially Hebron. However, this barely affected our downstream analysis since we have few Telegram messages and little GPS data about urban Hebron checkpoints.
When matching the OCHA 2023 checkpoint list to the reviewed 2025 data, we could not match seven 2023 checkpoints. For these checkpoints, we used OCHA’s original 2023 location with a 25-metre buffer. A buffered point may intersect a route differently from a reviewed polygon. Any additional 2023 intersections produced by this method would reduce the measured increase in the number of checkpoints encountered on routes between 2023 and 2025.
OCHA’s database only includes permanent obstacles, so any flying checkpoints, temporary checkpoints that can be established at changing locations and times, are missing from our analysis as well. One flying checkpoint on the road from Nablus to Al-Badhan was added to the dataset because it appeared frequently in Basma Radio reports and its general location could be independently verified through satellite imagery, photographs from reports about the checkpoint and reporting on the ground.
Routing analysis
The routes returned by Mapngin represent the road network and access conditions captured by the service when it was queried. The comparison of checkpoint exposure in 2023 and 2025 applied both checkpoint datasets to the same baseline routes, giving a consistent measure of how checkpoint infrastructure along those routes changed. Historical route choice in 2023 falls outside the scope of that comparison.
Our representative trips cover a selected set of destinations, hospitals, universities and governorate centres. Other destinations and smaller communities fall outside our analysis. Route coverage in and around East Jerusalem is additionally constrained by the roads Mapngin makes available to Palestinian drivers, destinations it cannot route to are absent from the analysis. Jerusalem is off-limits for most Palestinian drivers.
GPS based estimates of time lost
The GPS data comes from vehicles using a private logistics service and do not form a representative set of Palestinian drivers. The company’s clients’ ability to choose routes or travel times may differ from those of the wider population. This could affect the scale of both the checkpoint waiting time delay and excess journey time estimates.
Checkpoint waiting times
If the drivers in our dataset were better able to avoid checkpoint delays, either because they are less likely to be stopped or because they are better able to choose travel times and alternative routes than the average Palestinian, then the analysis would understate how much delays checkpoints cause.
Given that the logistics company’s clients tend to drive substantial distances for professional reasons, this is not an implausible scenario. However, if the cars in the dataset were more likely to be stopped at checkpoints (some NGOs are using this service) and the drivers are less flexible in choosing their travel time and routes (some delivery vehicles are among the customers), then the delays may be overstated.
According to the checkpoint waiting time analysis, the delays directly caused by checkpoint queues are small for the average Palestinian. This may be surprising given how prominently violent and coercive experiences at checkpoints feature in our reporting and elsewhere. Looking at how much time people spend rerouting helps make sense of that finding. Violence at checkpoints, unpredictable closures and the risk of long delays give Palestinian drivers strong reasons to take substantial detours and avoid checkpoint interactions where possible.
Excess Journey times
For the excess journey time analysis, the reference for each origin-destination pair is based on the faster end of journey times that were observed in the GPS data after October 7, 2023. It represents an achievable journey within the road system Palestinians were actually using during this period. Restrictions that affect even the fastest observed journeys are included in that reference time, which can make the resulting excess time estimate conservative relative to travel under fewer restrictions.
We cannot fully attribute excess journey time to checkpoints. The calculation measures how much longer journeys took relative to the reference time without assigning every additional minute to a particular checkpoint or closure. However, extensive visual verification convinced us more circuitous routes were mostly consistent with detours that would be necessary to circumvent checkpoints.
The analysis also requires repeated GPS journeys. Localities with fewer than 5,000 residents and origin-destination pairs with fewer than 20 observed journeys are excluded, meaning smaller or infrequently travelled connections are less visible.