 10/02/20201


“We suffer a lot in our daily battle to access potable water. We bear the full costs, because if we didn’t, we would never have water. We can no longer take this! If you go into people’s houses here, you would wonder how anyone manages to live!”
The families of Najah Ihsan and Abu Al-Ola are a sample of one
million and 180 thousand Egyptian families without access to
drinking water. Their struggle to get a single glass of water
continues. In Egyptian folk we say that ‘water is plentiful (with
reference to the Nile river), yet it is elusive’. This investigation
examines the scandalous waste in the Egyptian water distribution
network .
By using open source data, the investigators document how the
mismanagement of drinking water facilities in Egypt has led to a
decline in the share of water per individual. They also show how
this has led to an increase of those deprived of water or have
minimal access to it.
Between 2014 and 2018, 95% of Egyptians had constant access to drinking water 24/7. During that same period those without access to this vital commodity increased threefold. The numbers jumped from 380 thousand in 2014, (0.41% of the population) to one million and 180 thousand (or 1.2% of the population). This marks an increase of 800 thousand people, according to the annual report of the Egyptian Drinking Water Regulatory Agency.
Sherif Abu Al-Ola from the Nagaa Salem district is one of those people without access to water. He relies on his neighbours to get water for his family of eight. As for the quality, he says, “The water we drink is of the same quality as the water we give to livestock, but what are we going to do about it? It’s all in the hands of God!”
Large quantities of water are lost through leakages in the distribution networks. The average annual loss reaches 3 out of every 10 liters produced by the treatment and pumping stations. As a result, the share of drinking water per capita per year decreased from 86 cubic meters in 2011 to 63 cubic meters in 2018 (approximately 25% reduction).
To determine why this is we traced the journey that drinking water makes, starting with its source and annual reserves, through the process of transportation, treatment, and distribution. A look at the state’s expenditure financing this sector, and a thorough examination of the data revealed deficiencies causing the decline in the share of water per capita. It also highlighted discrepancies in the share of water reaching different communities in different Egyptian provinces.
Egypt’s water resources come from the River Nile with 7 out of every 10 liters coming from the river. Approximately 2 liters come from the reuse of wastewater while the remaining liter is derived from under ground water and rainwater. This is according to the 2019 report on water resources published by the Ministry of Water and Irrigation. The total water volume drawn of these resources reached more than 80 billion cubic meters in 2019, compared to approximately 74 billion cubic meters in 2011.
Despite this increase, the percentage of drinking water out of total
usage has remained almost constant in recent years at 13 per 100
liters. At the same time, water use in industry increased three and
a half times since 2015 to reach 7 per 100 liters, instead of only
two liters previously.
Najah Ahmad is a teacher who lives in the village of Ash Shawriyyah
in the Nagaa Hammadi district in Qena. She says, “Our village is
supplied by water pipes coming from a neighbouring village, but the
water flow is either weak or the supply is intermittent. The pipe
system is old and perishing, allowing for some residue to seep
through the water”.
She adds, “We also have to use a water pump for the water to be
stored in a large tank that was erected on the roof, which we
have to refill daily.”
In comparison to her sister, Najah’s problem is small. She says
that her sister “suffers more because water does not reach her
second floor apartment, and in the summer season, she has to
travel far to fill up jerrycans which she carries all the way
up”.
She continues, “Some use wheelbarrows to transport the water as
they cannot carry it. We often have similar problem when the
pump fails and the tank is empty, so we buy barrels and fill
them up with water and allocate one or two for bathroom use and
a similar amount for drinking. Most women suffer from back pain
as a result of carrying jerrycans for long distances.”

Nadia Ehsan* has devoted her life to helping those who do not receive regular water supply through her charitable association in Qena, as “many villages do not get enough water, and there are villages that drink salty water, hence we try to support some through desalination plants.”
Before water reaches the consumer, it is processed by various types
of water plants. However, the amount available to the consumer is
less than the amount produced by these plants. This is due to
leakages in the water distribution networks.
Loss of water is one of the main reasons behind the waste of
drinking water. The annual rate of loss exceeded 2600 million cubic
meters between 2014 and 2018. This means that there are more than 3
liters wasted for every 10 liters produced by all water stations.
Ahmad Ridha, media officer of the Holding Company for Water and
Wastewater, explains that “There is a natural loss of water due to
the laws of physics (condensation and evaporation) and as a result
of network washing operations. Water loss happens also due to burst
pipes, and the company is trying hard to repair the leakages. Some
water is also lost due to violations where people simply connect to
the mains to access water, and the authority work hard to stop this
practice”.
Despite the increase in the volume of water produced year on year,
percentage of water loss through the distribution networks has been
increasing simultaneously. The water waste recorded in 2011 amounted
to approximately 25% of the water produced. In 2018, 34% of water
produced was lost to leakage and waste in the distribution network
according to the Egyptian Central Agency for Mobilization and
Statistics.
Dia’a Al-Qoosi, water expert and advisor to the former Minister of
Irrigation says, “In Japan, the loss reaches only 5%. If the inlet
filters at the Egyptian treatment plant were efficient, they would
not allow residues permeate and later clog the valves and filters.
Additionally, if malfunctions, even in the case of new pipes, were
to be addressed immediately, water loss would decrease. The
distribution network, its valves and flushing gates must all be
maintained periodically.”
One study indicates that the economically acceptable level of water
loss ranges between 5% to 10% depending on the source of water. In
his response to our email, Vice President of the Middle East Water
Forum, Hassan Abul Naja put the ratio that is acceptable for Egypt
at 20%.
The media officer at the Holding Company for Water and Wastewater in
Egypt, says “The company try its best to reduce water loss through
the distribution systems all the time. We have leaks detection
programs in all district metered area (DMA), once a leak is
detected, measures are taken to reduce the loss. First, we make sure
that meters are installed and that additional problems in the
networks are fixed. This procedure has been applied in many areas
and was effective in helping reduce water losses”.
The provinces of Suez, Ismailia and Port Said topped the list of Egyptian areas that recorded the highest water wastage in 2018. Those provinces lose approximately 64 liters per every 100 liters produced compared to half that percentage in 2011, when Suez lost 44 per 100 liters, Ismailia 42, and Port Said 11 respectively. Cairo and Alexandria recorded 31% and 28% water loss in 2018, which Ridha attributed to the size of the network in those governorate and any leakage or burst pipe usually lead to huge wastage compared to other smaller networks.

There are various types of water treatment and pumping stations in Egypt, including surface, underground, and desalination water stations. The total number of these indicates that during the above mentioned seven years, the number of stations increased annually by an average of 44 stations, but dividing them by the type of water shows a different reading.
The Nile water forms the largest source of surface water in Egypt. In 2011, there were more than 2000 surface treatment and pumping water stations, but this number dropped to less than half in 2018. According to data published by the Egyptian Central Agency for Public Mobilization and Statistics, more than 1100 stations were taken out of service gradually at a rate of 161 stations annually.
Despite the significance of the drop in numbers, the media officer
of the Holding Company for Drinking Water refused to acknowledge the
problem and stated, “Stations are in service all the time; no
station goes out of service; rather, some stations undergo
improvement work. Surface water stations especially do not decrease
in number, this may happen in the case of underground water stations
if the level of salinity in their water increases, then the station
is taken out of service based on a decision of the Ministry of
Health.”
Rasha El-Khouli, Dean of the Faculty of Engineering at Heliopolis
University, explained that this decline may have occurred as a mean
to renew or replace old water pumping stations. This might include
updating the technology used, or modernizing old production systems.
The situation is different with drilled well pumping stations. The
number of those stations increased by one tenth, from 1456 stations
in 2012 to more than 1600 stations in 2018, with an average annual
increase of 25 stations. Only the number of New Valley stations were
included in the 2011 bulletin.
As for desalination plants, they increased by about one station
annually, bringing the total in 2018 to 44 stations, compared to 35
in 2011. 2018 was the last year in which the annual bulletin for
drinking water and wastewater was issued. According to Ridha, after
that “there was a big surge in the number of desalination plants.”
The figures discussed above covers the number of stations of all
types, but what about their real production capacity?
Each water station has a design capacity that represents its maximum
(possible) output, and an actual capacity. In 2011, surface water
stations showed a significant difference between the two capacities
in most governorates, and this brought their overall actual average
capacity to 61%, but this difference narrowed in 2018 to become 75%
of their design capacity. However, the stations in 14 governorates,
operated at less than this average.
These numbers help us understand the overall production capacity.
Ridha says that the design capacity of the stations takes into
account future (expansion) plans up until 2030. He says, “this takes
the needs of residential areas into account based on expected
expansion and the rise in population numbers. Accordingly, the
design capacity of the station takes these elements into
consideration since we are unable to build stations every day.
Therefore, a station is designed with a capacity that can encompass
a number of years while actual operation is done according to the
current population needs.”
As for the drilled well stations located in 20 governorates, the
average operation at actual capacity reached 31% of the design
capacity in 2012 and then increased to 50% in 2018. Eight
governorates worked at less than this percentage with Matrouh and
Qena using the least of their capacity. In these governorates the
water pumping stations worked at only 5% and 7% of their design
capacity. The governorates of Upper Egypt form half, that is, 5 of
the 10 governorates that are at the lower end of the scale. Dakahlia
was the only governorate that surpassed 90% operation rate, a figure
that was attained by Beni Suef right behind Dakahlia in ranking,
followed by North and South Sinai.
Ridha explains, “We strive to improve the amount of water produced
in terms of quantity and quality at all times. If there is an
opportunity to serve an area with drilled well stations, we do that.
Sometimes, if surface stations enter into service and can deliver
the designated areas with enough water, then we close the wells and
content ourselves with surface water.”
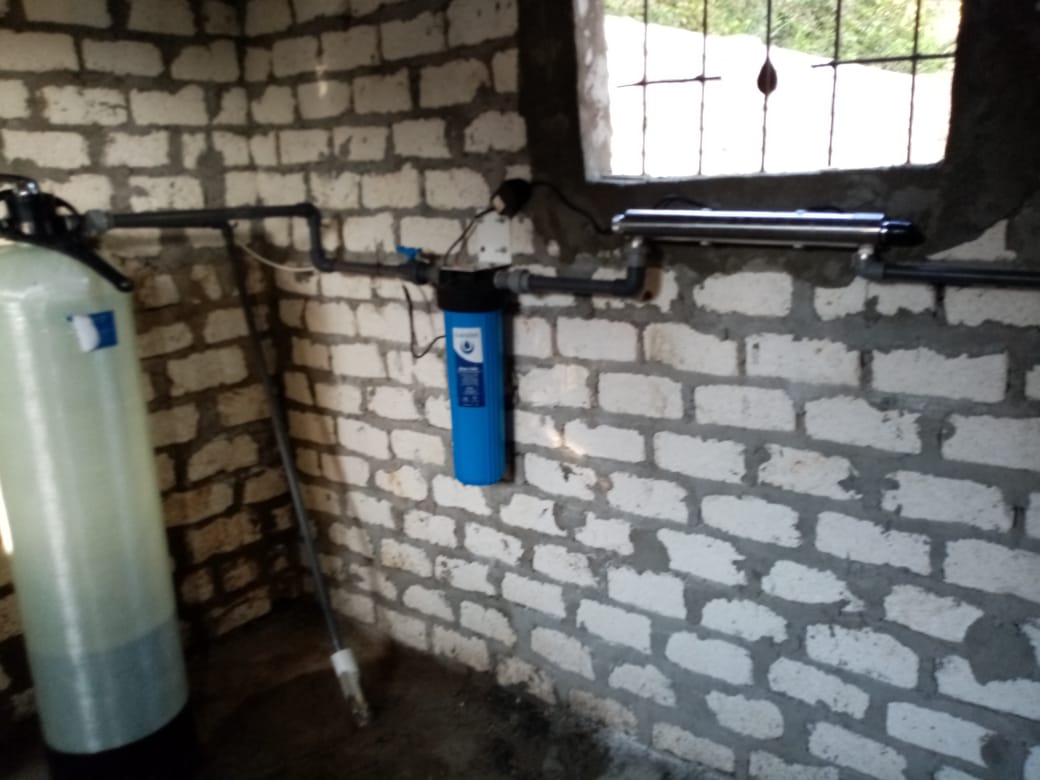
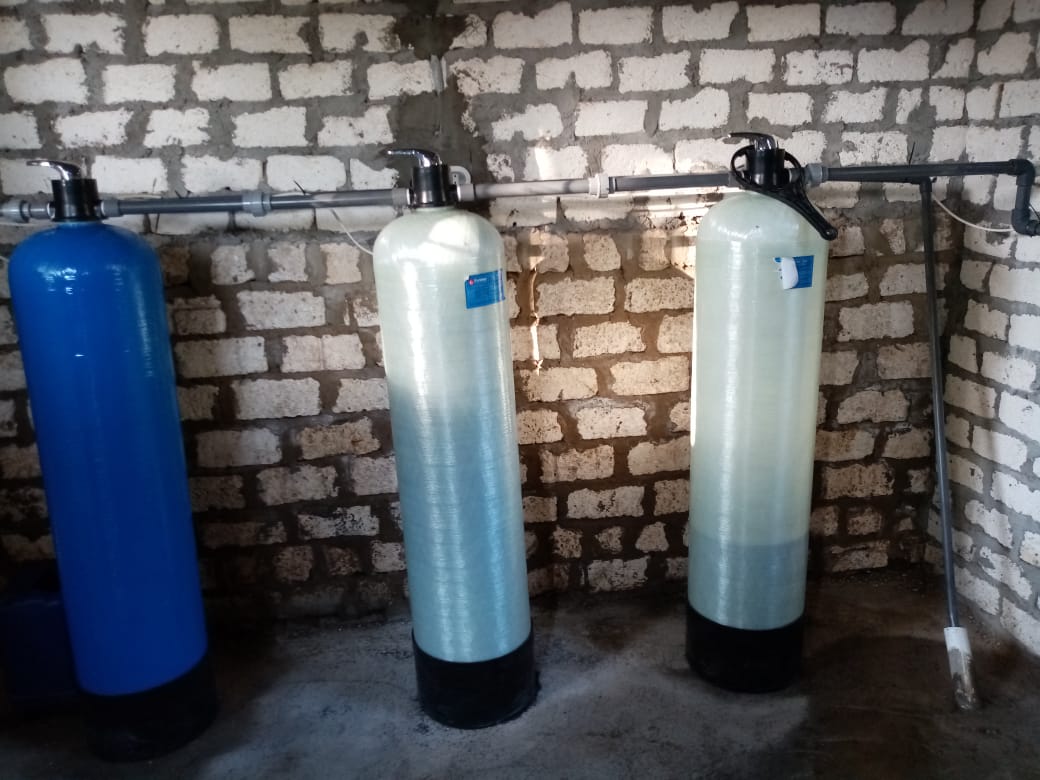

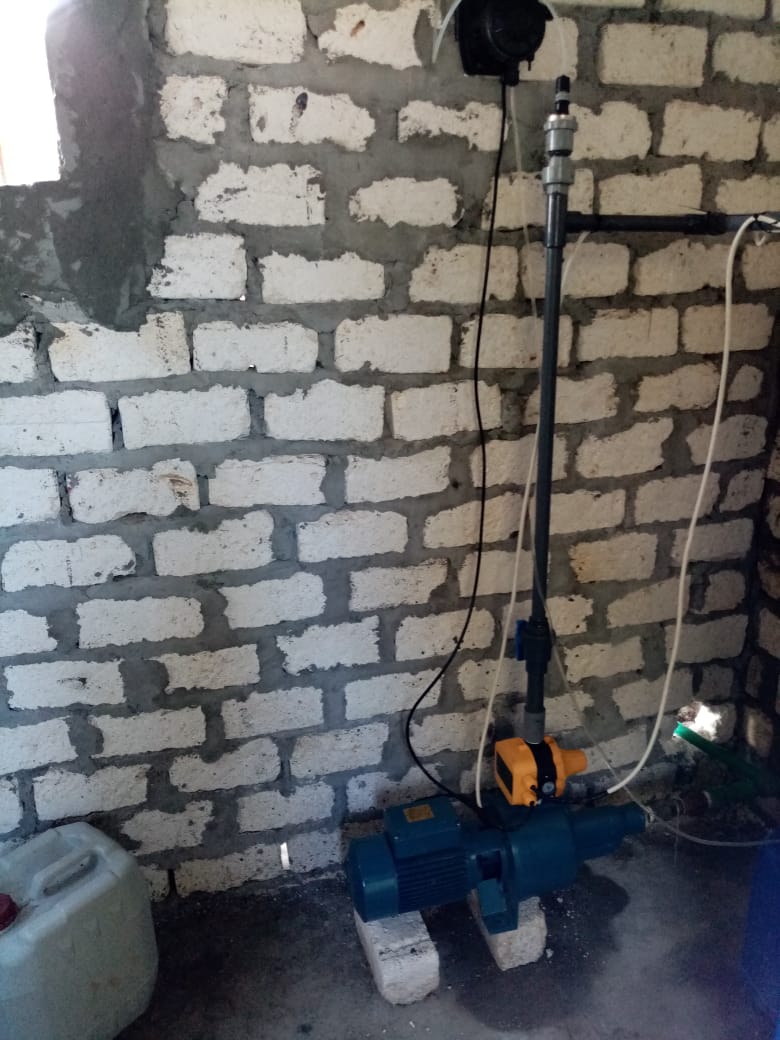
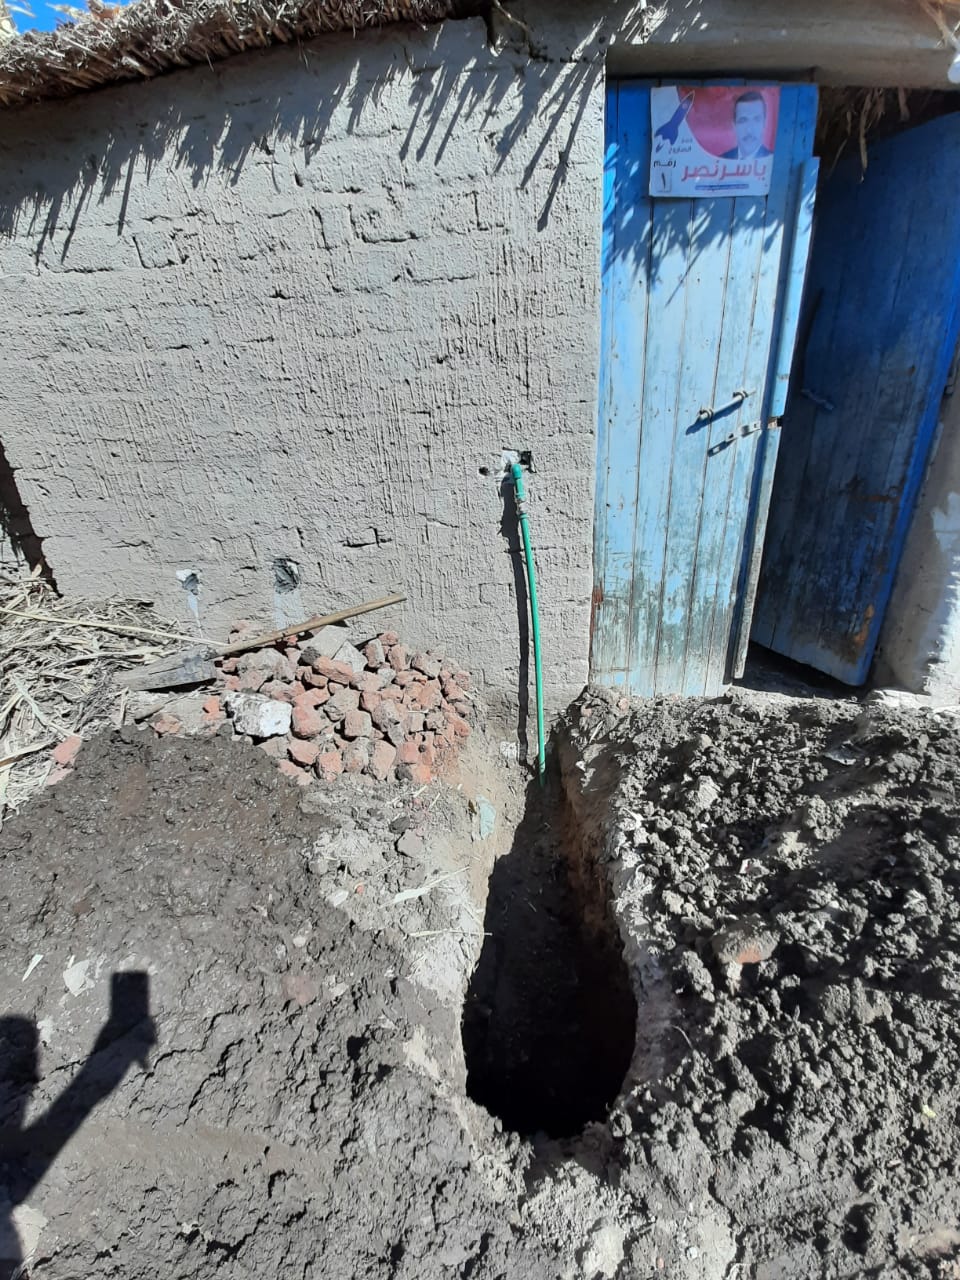
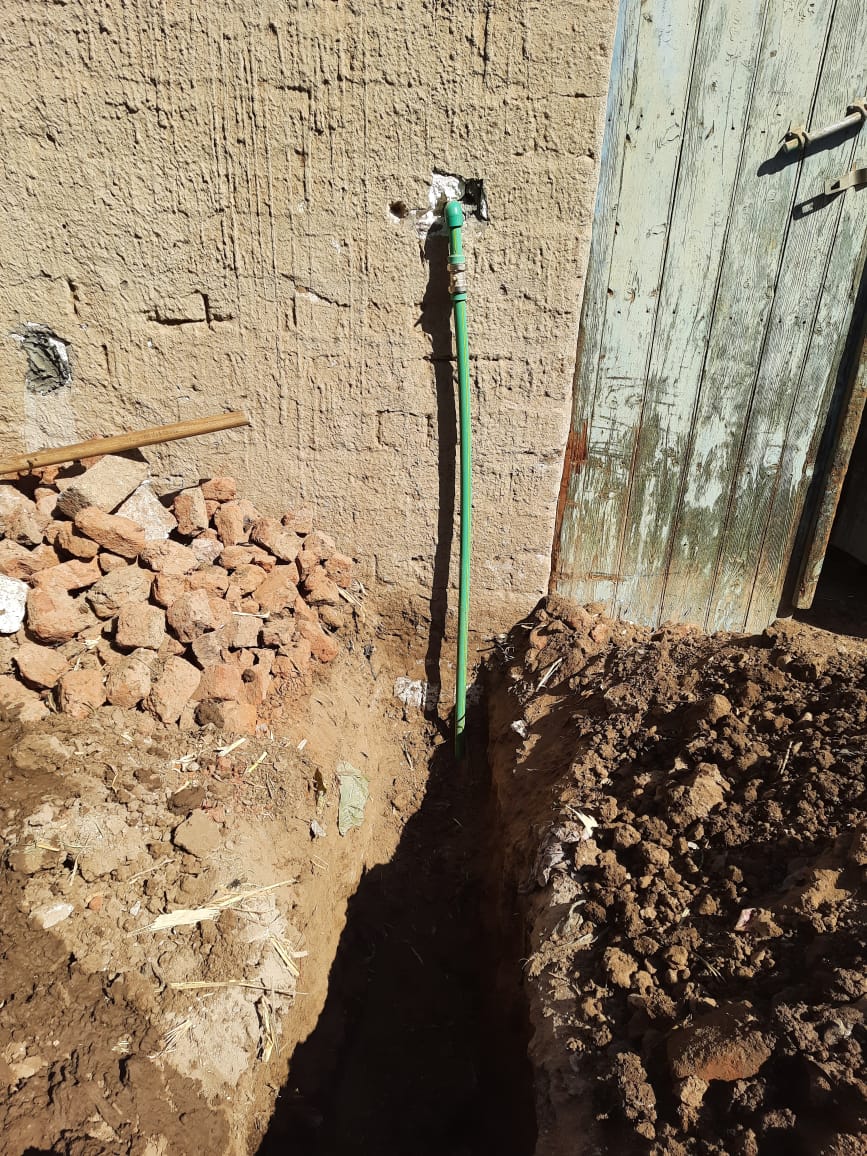
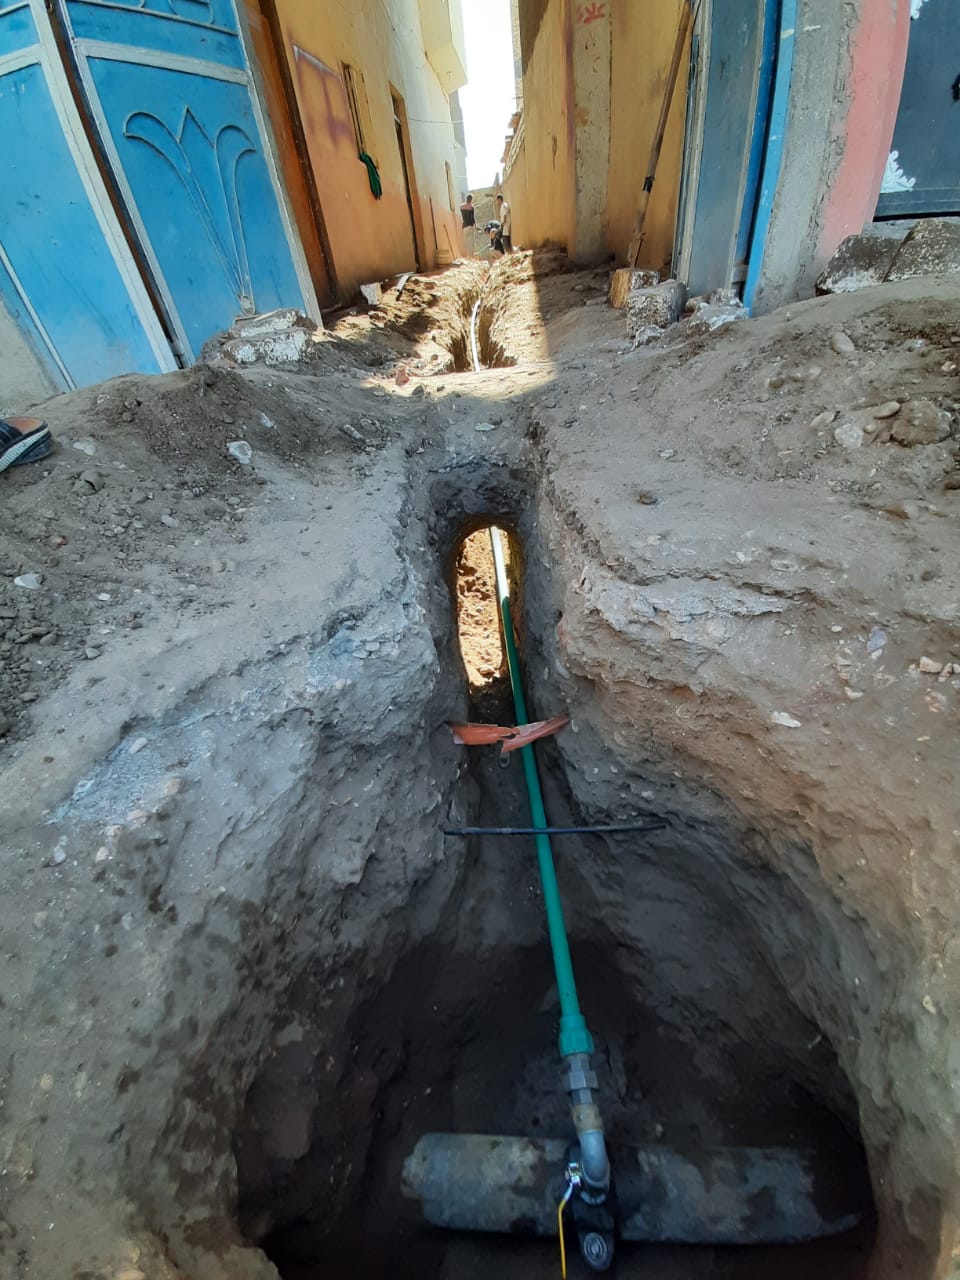
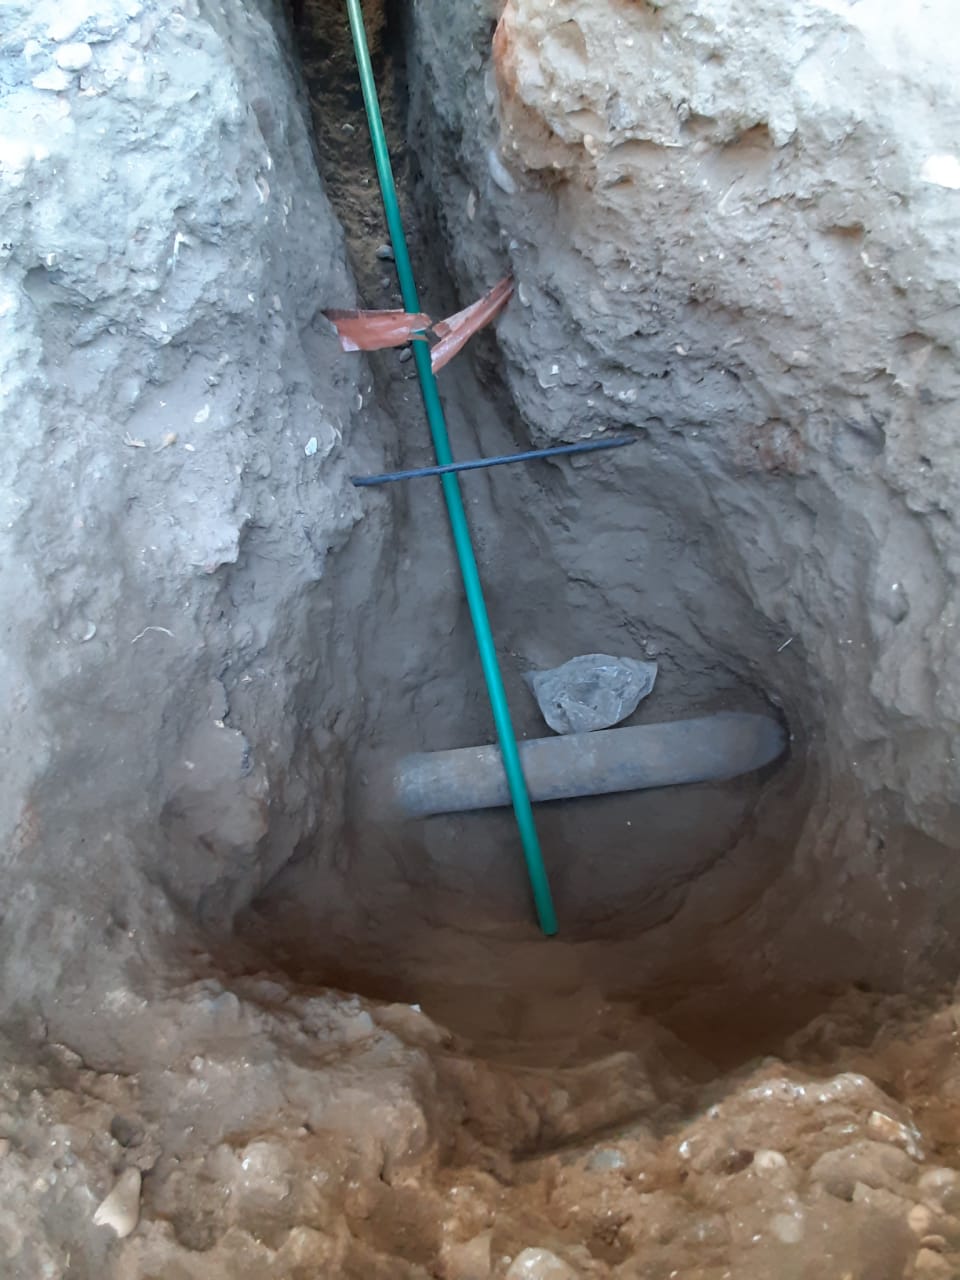
 Photo of the pump
Data indicate that the total amount of water produced between 2011
and 2018 did not witness a major increase in terms of quantity; it
experienced slight increases and decreases year on year. However, a
comparison between the first and the last years shows that for every
100 liters produced in 2011, 98 liters were produced in 2018. This
is not commensurate with the continuous increase in population
numbers; hence, there is a need to produce more not less.
Accordingly, the share per capita decreased from 110 cubic meters of
water per year in 2011 to 89 cubic meters per year in 2018, that is
a decrease by one fifth (20%). The total amount of water produced in
2018 reached more than 8700 million cubic meters. The governorates
of Cairo, Giza, Alexandria and Dakahlia produced about half of this
quantity at 48% while the remaining twenty-four governorates
produced the other half.
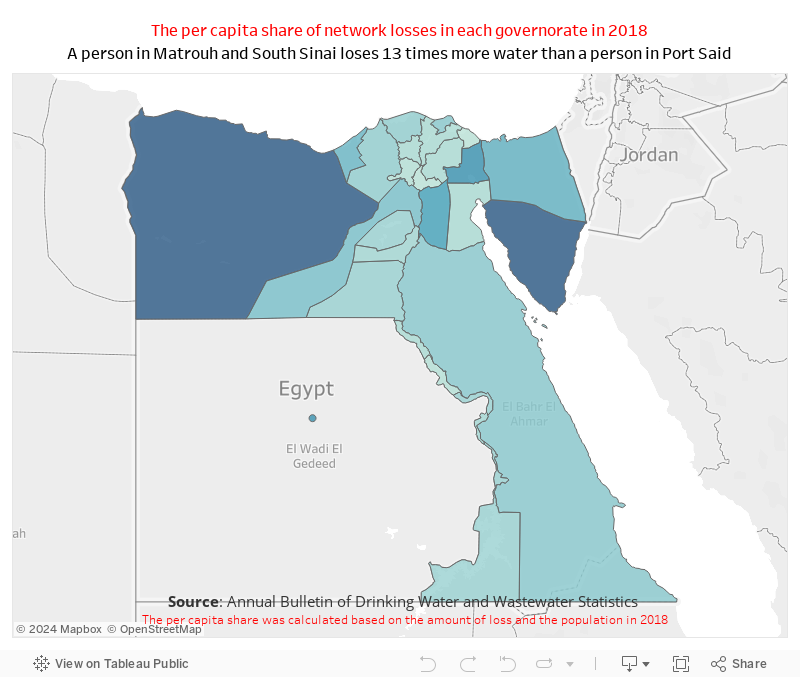
The share of the water produced per capita varies greatly in Egyptian provinces. In South Sinai, the share per capita was 28 times greater than that in Port Said and 14 times more than in Suez. These are the two governorates with the lowest share of water per capita, followed by Qalyubiyya, Minya, Sohag, Monufia, Asyut and Beni Suef and Qena. Naturally, this has affected levels of consumption. Comparing the two years of 2011 and 2018 reveals that for every 100 liters consumed in 2011, 88 were consumed in 2018, marking a decrease of 12%. In this way, the share per capita decreased by about a quarter, dropping from 86 cubic meters per year in 2011 to 63 cubic meters in 2018.
Rasha El-Khouli explains the sizable disparity between governorates
and says, “several factors affect the overall levels of consumption
and disparities between provinces, like standards of living and
social and economic setting of each province”.
Al-Qoosi on the other hand believes that raising awareness towards
rationalising water consumption is essential. She explains, “If only
one faucet leaks water, it wastes 3 cubic meters in a year. If we
assume that we have more than 10 million housing units with nearly
50 million leaking faucets, it means that 150 million cubic meters
per year are wasted. Wasting dirty water is a mistake, but wasting
clean water is a sin.”
The comparison between the quantities consumed 2011 and those
consumed in 2018 shows a marginal increase in consumption per capita
in 8 governorates.
Ihsan from the charitable organisation cites an example of the dire
situation of a particular village and its access to water, she
explains, “A village called Hindi only receives water through
government tankers every 10 or 15 days when people fill up their
jerrycans and then wait for the water vehicles to pass again.”
Photo of children filling water from tanker trucks
Egyptian drinking water utility falls under the control of the
Ministry of Housing and Population. The Executive Body, and the
National Authority for Potable Water and Sewage, are responsible for
offering, awarding, financing and supervising drinking water
projects. The first entity (the executive body) covers the
governorates of Greater Cairo and Alexandria while the second looks
after the rest. In the state’s general budget from 2010 to 2020, the
total expenditure on water supply amounted to more than 94 billion
Egyptian pounds, that is, more than 9 billion per year. The National
Authority’s share of this was about two-thirds. According to the
budget figures from the fiscal year 2017-2018, the amount of 9
billion represents three quarters of the state’s public spending on
water facilities.
Costs cover wages, grants and benefits in kind, and the purchase of
goods and services related to water treatment plants. The share of
maintenance expenditure came to an average of nearly 70 million
Egyptian pounds per annum. This means that for every 100 million of
expenditure, less than one million is designated for maintenance.
Although the National Authority’s expenditure is double that spent
by the Executive Body, the difference was huge in terms of
maintenance. For every 100 million the Executive Body spends on
maintenance, the National Authority spends only one million,
although it is in charge of 23 governorates, compared to only the
four governorates under the Executive Body.
On the other hand, the organizations do not achieve any financial surpluses; rather, they suffer from a large deficit between expenditure and revenue.
The average total costs in the Holding Company for Water and
Wastewater is set at more than 6 billion Egyptian pounds annually.
An average of 400 million pounds is spent on service supplies,
including maintenance among other issues, according to the Annual
Bulletin for Economic and Statistical Indicators for Public
Enterprise and Public Sector Companies. This bulletin is issued by
the Central Agency for Mobilization and Statistics.
Therefore, for every 100 million the company spends out as general
operating cost for water production, only 6 million is allocated for
maintenance, which is less than one-tenth. Calculating this
percentage from the overall production and operational cost
perspective means that for every 100 million pounds, there is a
total of 15 million pounds earmarked for maintenance requirement
which form less than one-fifth of the amount that was spent between
2008 and 2016.
The company’s media officer states, “The sums allocated for
maintenance go entirely towards that. There are operating
requirements, such as electricity, chlorine and alum. Sanitation
plants need chemicals for treatment. All these sums are continuously
monitored by the Central Auditing Organization.”
He stresses, “These amounts are not assigned randomly, but according
to the general plan that determines the number of stations and
networks and their cost in each governorate. They are also updated
in five-year plans in addition to an annual plan on the basis of
which budgets are approved. There are mechanisms for determining all
this.” However, the 2017-2018 report of the Egypt Water, Sanitation
and Consumer Protection Agency highlights the financial challenges
that have affected the size of the funding required for maintenance
and operation. These challenges limited their ability to improve
performance. There are also technical challenges such as “the
inefficiency of the replacement and renewal programs, the weak
periodic maintenance programs and the lack of technical expertise.
All these have led to a high rate of water loss, irregularity in
service, low water quality, and the inability to extend drinking
water and sanitation services to the more deprived and poor areas.”
Access to potable water in Egypt remains a nightmare for millions.
Reforming the treatment, pumping, desalination, and maintenance of
the distribution network requires an executive will and practical
steps. All should converge to limit leakages and waste of this
precious commodity.
*Nadia Ihsan is a pseudonym